


Ethereum sentiment worsens when the ETH/BTC ratio drops near 2020 levels.
Ethereum’s price has underperformed this cycle. While Bitcoin’s price rose to a new all-time high, Ethereum did not. Rather, it peaked at $4,107, 18% below its all-time high of $4,868.
This has caused the Ethereum-to-Bitcoin ratio to fall for more than 1,190 days. With ETH/BTC just breaking down from a crucial horizontal support level, it is interesting examining its price behaviour to determine where it may bottom.

The ETH/BTC downtrend continues.
The weekly ETH/BTC chart illustrates that the price has been trending downward for 1,190 days. The slide began with a peak of ₿0.088 in December 2021.
After reaching a low of 0.085 in September 2022, the price continued to fall.
The slide is the longest in history, surpassing the 805-day downward trend since the all-time high of ₿0.157 in June 2017.
In 2025, Ethereum’s price fell below the ₿0.027 horizontal support level. This location is crucial because it has offered both support and resistance since 2017.
The current cycle’s low has produced the closest support area of ₿0.017.

Technical signs are negative. The Relative Strength Index (RSI) and Moving Average Convergence/Divergence (MACD) are declining. The RSI is below 30 and the MACD is negative, indicating a bearish trend.
So, the weekly period indicates that Ethereum will continue to lose ground to Bitcoin.
Ethereum Sentiment
Despite the enormous decrease, Ethereum advocates remain optimistic about a bullish trend reversal. CryptoELITES observes parallels between the 2017 and 2025 trends, implying that a breakout is imminent, initiating the altcoin season.
Merljin, the Trader, sees a similar fractal, calling the present dip a fake-out that will result in a big pump.
TitanofCrypto predicts that whales are accumulating Ethereum, resulting in a huge price surge soon.
CryptoFella predicted a comeback by retesting a descending resistance trend line, while Crypto Rover is bullish due to Donald Trump’s considerable ETH allocation among its cryptocurrency holdings.
As a result, despite its significant underperformance, Ethereum aficionados remain optimistic and believe a rally is on the horizon.
When Will Ethereum Hit Bottom?
The long-term wave count indicates that the ETH/BTC price is in wave C of an A-B-C correction (red), which began after the all-time high. The subwave count is shown in black.
If the count is correct, Ethereum is in sub-wave three of a five-wave drop. This is typically the steepest part of the downturn, which explains Ethereum’s big decrease.
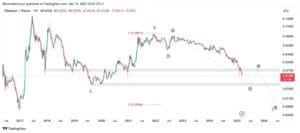
Giving waves W and Y equal length results in a low of ₿0.009. While this will be the lowest price since 2017, it will not be a new all-time low.
Closing over the ₿0.027 resistance invalidates this count and indicates the correction is complete. This currently appears unlikely.
Ethereum underperforms Bitcoin.
Ethereum’s price has fallen against Bitcoin for more than 1,100 days. The price movement and indicator readings indicate that this will continue for the remainder of the year. A probable bottom is at ₿0.009.